By Stef Garasto
We have been developing new methods to measure regional skill demand across the UK, to aid decision-making at a local level.
To date, official statistics on job vacancies have only been available by industry, with sparser information on vacancies disaggregated by other variables. Using millions of job adverts, we have built a methodology for estimating vacancies by region, as well as by occupation and skill group. We hope that these new series will provide local decision-makers with more granular information on employer skill demands in their regions.
This research has been funded by the Office for National Statistics (ONS) as part of the research programme of the Economic Statistics Centre of Excellence (ESCoE). The full report can be read here.
We need detailed measures of skill demand
The coronavirus pandemic has highlighted how a system shock can result in very distinct impacts specific to, for example, industry and location. Because of this, and in line with their growing responsibilities for skills policy and funding, local governments are seeking timely and detailed indicators on local skill demand. Official statistics on vacancies (a measure of skill demand), derived from ONS surveys, are one such source of information.
The ONS’s Vacancy Survey is a monthly survey that asks businesses how many vacancies they are currently trying to fill. The survey provides intelligence on how many vacancies are available across the UK by industry (for example, “Education”) and by company size. Information on vacancies and skill shortages are also available from the Employer Skills Survey. This survey provides comprehensive details about employers’ needs, and is conducted every two years (at the time of writing, the latest data available is from 2019). There is also a delay between the data collection and publication of the results.
While these surveys contribute a wealth of knowledge about skill demand in the labour market, they don’t provide a breakdown of vacancies by occupation, location and type of skill. This information could tell us how much demand there is for “counselling” skills or “Social workers” in Cardiff, for example. Making these types of detailed indicators available is important for supporting local authorities and career advisors in developing targeted responses to labour market challenges.
Novel sources of data can help
Job adverts can help us to develop a more detailed understanding of skill demand, and supplement the insights from existing statistics and surveys. A job advert can give information not only on the “existence” of a vacancy, but also on the location of the vacancy, the occupation that it is relevant for, the industry of the hiring company and the skills that are required. The strength of jobs adverts lies in linking many different labour market features to a single place. Moreover, as new job adverts are released every day, they are also a very timely source of information.
In light of these benefits, a growing number of organisations are using online job adverts to conduct economic analyses. For example, the ONS have been among the first to study what job adverts can tell us about labour market statistics. The ONS are now releasing weekly indicators of vacancies, by NUTS1 regions, from online job adverts. Our research can complement the ONS’s work by offering a finer regional breakdown of skill demand, as well as insights by occupation and skill category.
Nesta has also used online job adverts in the past to measure regional skill mismatches and the role of creativity in the future job market.
Job adverts are not a perfect solution
Job adverts are a “naturally occurring dataset”. As a result, they have limitations to consider.
- The information contained in job adverts is not structured in a standardised way – for example, salary information may be lacking or may be presented in different formats (e.g. annual or hourly pay).
- Job adverts can also contain various biases, which means that they may not represent all vacancies. This could be due to imperfect coverage, for example, or variation in recruitment practices. Online postings tend to be biased toward high-skilled professional occupations and certain industries like “Information and Communication”, whilst other sectors like “Accommodation and food service activities” can be under-represented. Hence, estimates of vacancy levels cannot be directly inferred from online job postings only.
- Finally, the number of new vacancies posted on any given day represents the “flow” of vacancies. This is distinct from the total number of vacancies that are open at a specific time, which is the “stock” of vacancies. The flow cannot be compared directly to employment levels (which is a stock of workers) or even to the vacancy numbers estimated by the ONS Vacancy Survey, since the survey measures the stock of vacancies. Thus, we need a method for converting the flow of vacancies into a stock.
A method to extract insights from job adverts
Job adverts can be a rich source of information. However, due to their limitations, we needed to develop robust methodologies before we could extract insights from them. Textkernel provided our dataset of online job adverts, which contained over 40 million adverts for UK positions, collected between March 2015 and October 2019.
First, we converted the flow of job adverts into a stock of vacancies using detailed information on their life-cycle. Second, we assigned each job advert to a broad industry category from the UK’s Standard Industrial Classification. Third, we used data from the ONS Vacancy Survey to correct for some of the biases in job adverts. Specifically, we adjusted the monthly numbers of online job adverts by industry to ensure that it aligned with the numbers in the ONS survey. We did this by giving each vacancy a weighting.
Grouping skills from online job adverts
Over 10,000 different skills are mentioned across our dataset of online job adverts. We used a skills taxonomy to group the skills and to understand employers’ needs for meaningful categories of skills. For example, instead of tracking the demand for “delivering lectures” and “marking assignments” separately, we could track demand for them collectively as part of the group called “teaching”.
Building on earlier work at Nesta, we produced a skills taxonomy that combined an established skills framework, the European multilingual classification of Skills, Competences, Qualifications and Occupations (ESCO), with the list of unique skills mentioned in online job adverts. Using machine learning, we determined which skill category was the best container for each skill extracted from adverts (for example, “database management” was closest to “data science & data engineering”) . We then assigned each vacancy to a skill category from the taxonomy (e.g. a post for a “teacher in secondary education”). This enabled us to break down the stock of vacancies by skill category.
In future research, we will build on this approach so that we can assign a single job advert to multiple skill categories. This will allow us to capture more fully the skill set needed for a particular post.
New granular estimates of skill demand
Putting all the pieces of the puzzle together, we can produce new granular estimates of skill demand. Building on existing survey data on vacancies, we are able to show the regional variations in the stock of skill demand, broken down by industry, occupation and skill category. But what can this tell us about the labour market?
Skill demand by location
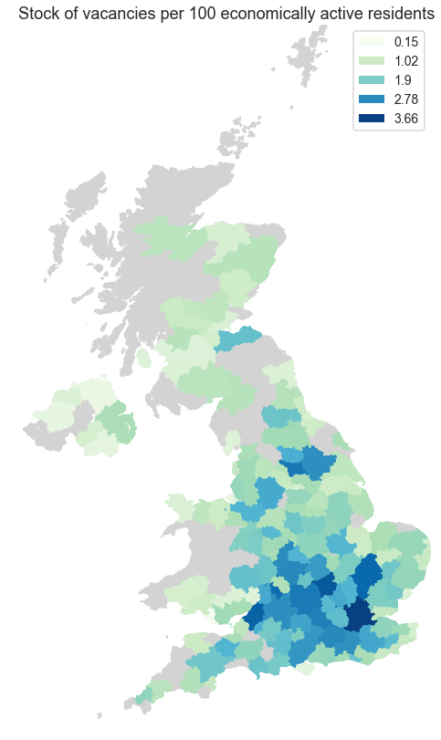
The map below shows the normalised stock of vacancies by Travel To Work Area, averaged across all years from 2015 to 2019. Here, we divided the estimated stock of vacancies in each area by the number of economically active residents and focused our analysis on areas with at least 40,000 economically active residents (excluded areas are shown in grey).
Overall, there is considerable variability in skill demand, with the stock varying more than five-fold across locations. Areas with higher levels of hiring activity seem to concentrate around London and in the South East. These results raise questions about inequality of opportunity in different areas of the UK, and may therefore be of interest for policymakers.
Figure: Skill demand by location
Changes over time in the make-up of occupations
We were able to produce estimates of skill demand by occupation, at high levels of granularity. We chose one top-level occupational group (“Caring, leisure and other service occupations”) as an example, and studied how the share of demand held by the more granular occupational groups had changed over time (these are called “minor groups”).
We focused our analysis on the 7 largest minor groups. As the figure below shows, most of these minor groups (5 out of 7) increased their share of demand between 2015 and 2019 at comparable rates, ranging between 60% and 100%. The two exceptions are “Animal care and control services” (-43%) and “Housekeeping and related services” (+10%). This tells us not only that the proportion of vacancies within “Caring, leisure and other service occupations” as a whole was growing, but also that the relative importance of its constituent occupations remained broadly stable. This type of insight may prove valuable for education providers, as they decide the areas within caring and leisure on which to focus their training courses.
Figure: Skill demand by occupation

Changes over time in the demand for skills by employers
By analysing the types of skills that employers asked for most often, we noticed that the share of demand for some skills, such as digital, had increased. We also found that the relative importance of different skills varied across regions.
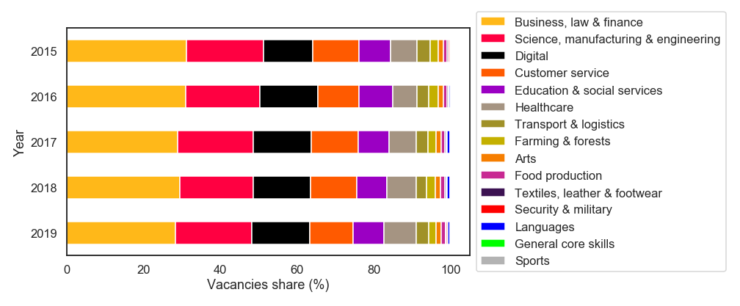
The figure below displays the composition of skill demand in the UK for each year between 2015 and 2019. It shows that:
1. Most of the demand was concentrated among three categories – “Business, law & finance”, “Science, manufacturing & engineering” and “Digital”. Together, these accounted for more than 60% of all skills demanded.
2. While the composition by category seemed stable across time, there were some minor variations. For example, the demand for “Business, law & finance” and “Customer service” skills decreased between 2015 and 2019 (-8.9% and -7.1% respectively), while the demand for skills in “Digital” and “Healthcare” increased (+18.5% and +21.4%, respectively). This echoes findings from a recent report from McKinsey, which identified IT and Healthcare as being among the industries with the highest predicted growth rate in Europe through to 2030.
While investigating how the demand for skills has changed across the UK, we found that specific digital skills such as “Web development” and “Software development” also had large regional variations. Demand for these skills was considerably higher in regions such as Edinburgh, London, Reading, Belfast and Cambridge than in others.
This type of insight may help workers, and those looking to (re-)train, to identify particular skill sets that are in-demand within their regions.
Figure: Skill demand by skill category
Final thoughts: a commitment to openness
This research has shone new light on how the demand for skills in the UK varies across regions, and how it has changed over time. It is worth noting, though, that our analysis to date applies to a pre-COVID world, as we used job adverts posted up until October 2019. However, our method can also be applied to more recent vacancies to analyse changes in skill demand before and after the pandemic began.
The broader goal of this piece is to contribute towards building better infrastructure and measurements for labour market intelligence. Openness is key to achieving this goal, as this allows the end-user to examine the methodology that has been applied, and to build upon our work. The report gives more detail on the full methodology and the underlying assumptions it is based on. Further to this, we have published the code that we have developed and used for this project, to ensure that other researchers can benefit from it.
You can download and read a copy of the Discussion Paper in full here.
Stef Garasto is a Lecturer in Data Science at the University of Greenwich, and was formerly a Principal Researcher (Data Science) at Nesta
ESCoE blogs are published to further debate. Any views expressed are solely those of the author(s) and so cannot be taken to represent those of the ESCoE, its partner institutions or the Office for National Statistics.


