By Ana Galvão, James Mitchell and Johnny Runge
Economic data like GDP are uncertain, due to sampling and non-sampling errors. One well known manifestation of data uncertainty is data revisions, the tendency for history to be rewritten as new information arrives and changes our view of past economic performance.
Data uncertainty means that the latest estimates of the Office for National Statistics (ONS), telling us that the UK economy in 2019 Q3 grew at 0.3%, should not be taken at face-value. This estimate of 0.3% is uncertain – and will likely be revised in the future.
While data uncertainty is well-recognised and understood by policymakers and statistical offices themselves, the widespread practice of communicating headline GDP estimates as point estimates arguably conveys a misleading degree of accuracy. The public may accordingly take early GDP point estimates at face-value. Or they may reason that the numbers presented to them are just estimates, and as such could well be inaccurate. We do not know.
In our study (read here) we fill this information gap. We use a randomised trial, conducted online, to assess if and how the UK public interpret and understand GDP data uncertainty. We pick up Manski’s (2015,2018) and van der Bles et al. (2019)’s calls for empirical studies on how communication of uncertainties associated with economic statistics affects users.
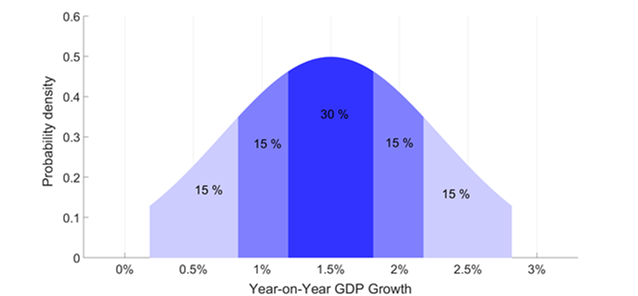
For our ESCoE study we randomly sample more than 3,000 (nationally representative) UK adults. The GDP data are communicated to individuals in the trial control group in a format that mimics recent ONS press releases. We then take a further step by evaluating how different ways of communicating and visualising data uncertainty affect user comprehension and interpretation of data uncertainty. This last step is implemented by measuring the effects of a set of randomised GDP data uncertainty communication treatments on a set of outcomes. The treatments include adding to the typical ONS press release an additional qualitative, qualifying verbal statement that emphasises data uncertainty. We also consider three quantitative, visual ways of communicating data uncertainty, including a bell curve that resembles the Bank of England’s famous fan chart. We then test if the public’s perception of data uncertainty and their understanding of the causes of data revisions and their trust in the data producer is affected by whether and how this uncertainty information is communicated to them.

We complement our public survey with a separate targeted survey of ‘experts’ (many of whom are economists), working in government institutions, industry and academia. Comparison with the public survey is instructive both in identifying if and how heterogeneities across users affect understanding and, in turn, whether there are different implications for how data uncertainty should be communicated to different audiences.
We find that the majority of the public, like experts, understand that there is uncertainty inherent in GDP numbers as typically communicated to them. They are not surprised when data are revised.
But, importantly, we then find that it matters if and how uncertainty information is communicated to the public.
Communicating uncertainty information alongside the GDP point estimate affects (and improves) the public’s understanding of why data revisions happen. It encourages more of the public (rightly) to view the GDP point estimate as just that, a point within a range of possible outcomes. Our experiments indicate, in particular, that it is especially helpful to communicate uncertainty information quantitatively using intervals, density strips and bell curves. This, in general, is preferable to textual descriptions and certainly better than no communication at all, beyond referring to GDP as an “estimate”. It decreases the chance that the public misinterpret the uncertainty information given to them.
Despite concerns voiced by some of the experts that we surveyed, our randomised experiments reveal that such quantitative communications of GDP data uncertainty need not reduce trust in the statistical office.
Our results for economic statistics are therefore consistent with emerging inter-disciplinary evidence that providing quantitative uncertainty information – “margins of error” – leads to a better understanding of the range of possible outcomes and better decisions by non-experts. But it need not erode trust in the data themselves.
A full version of this Discussion Paper is available here.
ESCoE blogs are published to further debate. Any views expressed are solely those of the author(s) and so cannot be taken to represent those of the ESCoE, its partner institutions or the Office for National Statistics.


