
By Stuart McIntyre
UK GDP was released on the 12th November 2020 and put growth in 2020 Q3 (July – September) at +15.5% relative to the previous quarter, but still 9.6% lower than a year ago, and down by around 8% on a rolling four quarter basis.
Coming off the back of a record quarterly decline in GDP in 2020 Q2, the UK economy is still estimated to be 9.7% smaller than it was at the end of 2019.
Using our regional nowcasting model, we have once again explored how these changes in overall UK economy translate into impacts on different parts of the UK.
It is important before doing so to make clear that we are not in any way incorporating specific information on the timings of local lockdowns into our model. Nor are we conditioning on any other COVID-19 specific information.
Instead, we are using the same model we have used for the last two years to model how developments in the UK economy translate into growth across the UK. Table 1 presents our headline results.

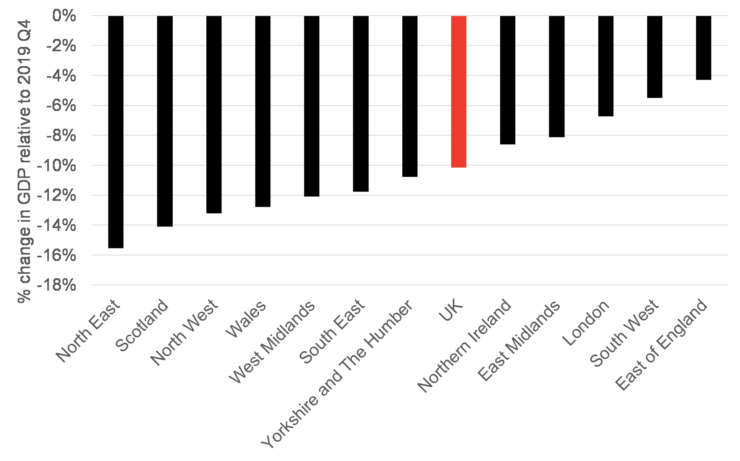
Another thing that we can do with our model is explore what it suggests has been the total change in regional GDP relative to the end of 2019. We show these results in Figure 1.
The key pattern from our results appears to be that areas that our model suggests have bounced back quicker in 2020 Q3 are estimated to have had smaller overall impacts from the pandemic (rather than it being, for example, those areas with the biggest hit in 2020 Q2 taking longer to recover).
Note that there are small differences between the ONS estimates and our estimates for the UK as a whole – this is the result of us using log differenced growth rates rather than exact growth rates in our modelling.
Official data for Scotland and Northern Ireland only go up to 2020 Q2 – and these suggest that the Scottish economy contracted by 19.4% in 2020 Q2, while Northern Ireland experienced a contraction of 13.6%.
However, the Scottish Government’s ‘experimental’ monthly GDP data are currently available to August 2020.
These suggest that growth between the end of June and August 2020 (so covering two months of 2020 Q3) was up around 9%.
These data also suggest that, relative to December 2019, the Scottish economy was around 10% smaller in August 2020. This is smaller than our own estimate from Figure 1 of around 14%.
Similarly, while we cannot do a full comparison between these Scottish data and the 4Q on 4Q results that we present in Table 1 (given the absence of September GDP data for Scotland to-date), doing this to August 2020 provides an estimate of around -8%, not too far from our own estimates.
For Northern Ireland, the official estimate of economic activity, on a rolling 4Q basis to 2020 Q2, is down by 5.2%, while our latest estimate over the same period is for a contraction of 6.4%. Given the scale of the underlying economic crisis as well as the associate economic and data uncertainty, this provides some reassurance on our results.
Conclusions
Nowcasting and forecasting activity at the present time is fraught with difficulty and heightened uncertainties.
Nevertheless, using our model to understand how the reported growth in the UK economy as a whole translates into growth across the UK, provides results which seem to benchmark to the available data for Scotland and Northern Ireland.
We will continue to track the underlying economic data in the months ahead and will update our results in February next year when we receive new data for the UK economy in 2020 Q4.
You can access all of our historic quarterly estimates here.
ESCoE blogs are published to further debate. Any views expressed are solely those of the author(s) and so cannot be taken to represent those of the ESCoE, its partner institutions or the Office for National Statistics.


