By Claire Cathro, Johnny Runge and Nida Broughton
Here’s a question: as far as you know, what does the term ‘unemployment’ mean when used in official UK statistics? Is it:
A. People who are actively looking for a job
B. People who do not have a job
C. People who do not have a job but are actively looking for one
D. People who work less than they want to (for example, they work part-time but want to work full-time)
The correct answer is C. However, if you didn’t get this, you’re in good company! Nearly 70% of the adults we surveyed were unable to correctly identify the correct definition of unemployment. Misunderstandings like this can help explain why a large proportion of the UK population feel unemployment seems higher than official figures suggest.
This particular example illustrates a broader problem uncovered in previous ESCoE research by the National Institute for Economic and Social Research (NIESR) that people often find economic statistics ‘confusing’ and ‘difficult to understand’. This is a problem. The economy affects every aspect of our lives; statistics about the economy provide us a window into how and why this is the case. If they can’t be easily understood by the people whose lives they impact, the information can’t help the average person make better decisions at home, at work or in their weekly grocery shop.
We know from our previous research that people think it is important to understand the economy, and particularly want to hear more directly from the producers of economic statistics, who they trust, without the usual filters of media and politicians. However, producers of economic statistics, like the UK’s Office for National Statistics (ONS), have traditionally produced and aimed their communications primarily for and at expert audiences rather than the general population.
The good news is that it is possible to make communications about economic statistics better understood by the general public with just a few tweaks. Previous work by Behavioural Insights Team (BIT) and the Bank of England looked at different ways of communicating the Bank’s quarterly Monetary Policy Report and the accompanying interest rate decision to a non-specialist audience. In those trials, we found that reducing the reading grade was more important than visuals in improving comprehension. Making the content relatable to peoples’ daily lives further increased comprehension, and improved engagement and trust in the information. The Bank of England incorporated these insights into their communication strategy, and into the development of different versions of their Monetary Policy Report, including one for a non-specialist audience.
This research found promising strategies to improve comprehension and trust in statistics, but left a range of questions unanswered about how these findings could be applied to other areas and types of communication about the economy. Therefore, the Economic Statistics Centre of Excellence (ESCoE) partnered with BIT and NIESR to work on how the ONS communicates about labour market statistics such as unemployment, inactivity, and vacancies.
As a result, today we publish two discussion papers exploring how to improve public understanding of economic statistics, using labour market statistics as a case study:
- Paper 1: Presenting labour market statistics to the public
- Paper 2: Media reporting of labour market statistics
What we tested: simpler labour market statistics
We designed five different versions of the ONS’ monthly labour market summary, with input from the ONS, and tested these in an experiment against a modified version of the existing labour market summary (the control), with 3,849 members of the public using BIT’s online platform, Predictiv.
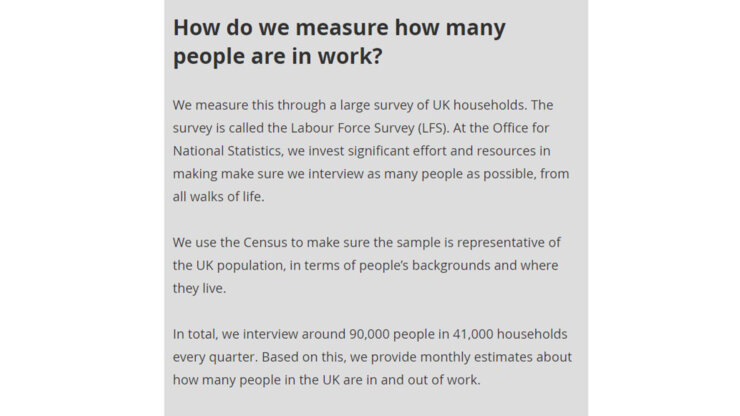
Our versions all used simpler language than the control. Some of our versions went further and changed the order of information, included a variety of graphics, provided an explanation of how data was collected, or provided case studies of different fictional people and how they would be categorised in official statistics, building on the relatability concept developed in the BIT and Bank of England work. We showed participants the summaries and then asked a series of questions to gauge participants’ comprehension, engagement and trust. A smaller group saw no materials but were asked the same question to establish a baseline.

We also looked at the role of the media in reporting on these labour market summaries, recognising that relatively few people are likely to search out information about the labour market on a regular basis and find the ONS website. We therefore interviewed eight journalists about the life journey of a statistical release and how the information ends up in the news. We also conducted a content analysis of 458 news stories covering labour market statistics.
Three things we learned about communicating labour market statistics to the public
1. Our redesigned summaries increased comprehension scores
All of the redesigned summaries, with the exception of one, increased comprehension scores compared to the control version, by 3+ percentage points. The Simplified summary, which simplified language but otherwise was unchanged, performed similarly to the control version on comprehension. This suggests that simplifying language is not enough to improve comprehension in absence of other changes; however, we believe it is likely a critical prerequisite. Interviews with members of the public corroborated our findings from the online experiment. In general, they found the existing releases technical, jargony and difficult to understand. While there were mixed views, most interview participants thought our summaries were easier to read than the control version.

2. All the redesigned summaries increased engagement with the material, with some improving trust as well.
We saw increases in engagement – whether the participants thought the information was interesting or important – for all our redesigned summaries compared to the control version.
One of our versions which gave information about how data was collected to arrive at the figures, also increased trust in the statistics. Specifically, people who saw this information were more likely to report thinking that the statistics were free from political interference.
3. ONS releases drive media reporting and journalists can benefit from simplified, easier to read content
Content analysis of news stories and interviews with journalists confirmed that the content, format and language of the ONS labour market summaries and news releases drive reporting of labour market statistics in the media. While some stories translated ONS outputs into less technical language, others copied phrases and figures directly from the release and these were not always appropriate for a public audience. We asked the same comprehension questions to a small sample survey with journalists and journalism students as we did with the general population.
While the journalists scored better than the general population, they did not score perfectly, despite generally having higher levels of education than the general population and being more engaged with economic news. This suggests that there is still room for improvement in how journalists comprehend labour market statistics, and this could be improved by simpler, more intuitive reporting by the ONS.
What these results mean for policymakers
These results show that relatively small, and low cost changes to how the statistics are presented or discussed can result in improvements in public comprehension of, engagement with, and trust in economic statistics – all critical outcomes for a national statistical agency like the ONS. Therefore, we make the following recommendations about communicating economic statistics for all providers of statistics:
- Simplify language and make definitions of key concepts more salient to improve comprehension – on average, those that reported themselves very knowledgeable and engaged with economic statistics performed worse on questions asking them to identify key statistics from the text and apply and apply definitions of key concepts. Therefore, plain language explanations and salient definitions may benefit existing audiences of statistical releases as well as the general public.
- Increase the salience of important, but underreported statistics, including those about which there are strongly held misconceptions – economic inactivity is rarely understood by the public but is key for broader understanding of employment and unemployment rates, and rarely covered in the media. Increasing salience of economic inactivity in statistical releases, for example by breaking it down into reasons for inactivity such as illness, caring, early retirement, could help increase coverage and understanding of this content. It should be noted that the media has increasingly covered the rise in economic inactivity including among older people since we conducted the fieldwork for this report.
- Use various types of graphs and visualisations within communications to cater to people with different preferences – this could include tables, bar charts, in addition to the standard time series line graphs that are typically included. Adding additional explanations of what the graphs demonstrate could also help people interpret and make sense of them. Additionally, adding ways for people to interact with the data, e.g., in interactive time series data, could help the general public and journalists find and compare current statistics with previous trends.
- Consider launching a separate, standalone labour market summary aimed at the general public. The current ONS Labour Market Overview (and all the publications and data underneath) works well for many audiences, including some journalists that we spoke to. But our findings show that different audiences require different ways of communication. The general public, in particular, would benefit from the introduction of a version aimed for a non-specialist audience that would feature prominently on the website, for instance if people google ‘what is the unemployment rate in the UK?’
The discussion papers include many more findings and recommendations. You can find them here:
Paper 1: Presenting labour market statistics to the public
Paper 2: Media reporting of labour market statistics
ESCoE blogs are published to further debate. Any views expressed are solely those of the author(s) and so cannot be taken to represent those of the ESCoE, its partner institutions or the Office for National Statistics.


