
By Cain Baybutt
The rise and dominance of service industries in the UK has resulted in a progressive shift towards intangible assets used in production. Spending on intangible assets has grown faster and been more stable than spending on tangible ones. However, the differences in characteristics between tangibles and intangibles, as well as the way intangibles have been historically treated, might make it difficult for firms to accurately report investment in them.
The lack of a physical presence of intangible assets may make it more difficult to remember what investment has taken place, unlike tangible assets which can be seen and easily counted. A person working at a delivery firm is unlikely to forget about the new truck they purchased earlier in the year when it is parked next to the warehouse. By contrast, that same firm might have purchased a new piece of software, which the survey respondent might not have used or know about and cannot see. This is compounded by the fact that data on intangible investment might not be held in the same way – if at all. The survey respondent may rely on their company’s financial accounts to fill out the survey, so if accounting rules do not allow some intangible assets to be classified as capital assets the spending may not be recorded. Overall, the lack of a physical presence can lead to spending on intangibles to be forgotten.

Respondents may be more familiar with recording and reporting spending for some assets compared to others. Tangible assets have been treated as capital for a long time, both in business and national accounting. As such, there are clear definitions regarding what is and is not to be classified as investment. As above, this can lead to better record-keeping as well as greater knowledge of what spending to report on surveys where accounting rules differ to survey questions. The same is not true for intangibles, which are new to be appreciated as investment, and whose treatment varies significantly between business and national accounting. Therefore, the definitions might be fuzzy to the survey respondent, so we might expect tangible assets (and perhaps some intangible assets with clear definitions, like R&D) to be more accurately reported than intangible assets.
Fuzzy definitions may not be a problem as long as the asset is well-defined in each survey. As there are no internationally agreed definitions for uncapitalised intangible assets, it is at the surveyor’s discretion as to what to include in the definition of an asset. Thus, what the respondent chooses to include depends on the framing of the question. When there is an unfamiliar asset alongside a lack of detail, respondents may have different ideas as to what to include compared to the researcher. Given intangible asset surveys are often carried out under the auspices of research or innovation surveys, rather than official statistics collections, firms might also be primed or motivated to respond in a particular way.
Intangible assets are often produced continuously, so allocating spending to any specific period can be difficult. When a firm purchases an asset externally there is a record kept of the date it was acquired – making it relatively easy for the person filling out a survey to associate spending with a given period. By contrast, assets produced in-house may take several periods to produce with no easily accessible price, and so allocating an appropriate amount of spending to a given period is difficult. In these cases, the frequency with which firms are asked to fill out surveys may affect their responses as it may be easier to report the cost of an in-house project once it is complete rather than only partially produced.
In our new ESCoE Discussion Paper we match and compare responses by firms across a range of surveys and reveal considerable differences reported for spending on intangible assets. Our results suggest that spending on intangible assets – particularly for those not capitalised in national accounts – is easily forgotten as firms tend not report consistently across surveys. For those firms that do report positive spending across multiple surveys the amounts tend to be similar – although this depends on the asset. One explanation of the differences in spending reported is the framing of the questions asked. For example, spending on training in the UK Innovation Survey is narrower and less well-defined than training in the Investment in Intangible Assets surveys. The frequency of surveys also plays a part as there are large discrepancies between reported quarterly and annual investment figures for some assets.
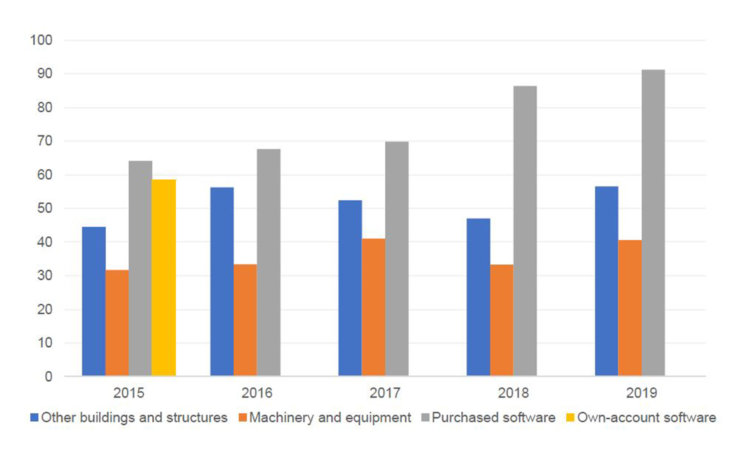
Source: ESCoE DP 2022-20, based on data from the Annual Business Survey and Quarterly acquisitions and disposals of Capital Assets Survey.
Notes: Standardised Total Percentage Error (STPE) is the sum of the absolute difference between the responses on each survey, divided by the value reported on the ABS, averaged across firms. Own-account software was only asked in QCAS in all four quarters in 2015. Only those firms that reported on QCAS in all four quarters have been included.
Given the challenges firms face in reporting spending on intangible assets surveys may need to adapt to get more accurate answers. Giving firms the choice over the period they report over would allow them the flexibility to choose dates that best match the data they have. The person filling out the survey may also appreciate guidance on where information relating to the survey questions are likely to be kept in the business, as well as grouping questions where these data are kept together. Moreover, given that spending on some intangible assets will not be recorded in the same way as for capitalised assets, making it clear to firms that estimates are acceptable is better than having no response.
Read the full ESCoE Discussion Paper here.
Cain Baybutt is Assistant Economist in the Multi-Factor Productivity team at the Office for National Statistics
ESCoE blogs are published to further debate. Any views expressed are solely those of the author(s) and so cannot be taken to represent those of the ESCoE, its partner institutions or the Office for National Statistics.

