By Stuart McIntyre
In light of Covid-19 and interest in understanding its economic impacts, including across the regions of the UK, this blog provides an extended discussion of our regular ESCoE regional ‘nowcasts’.
UK GDP growth in 2020Q1 was announced last week by the ONS to be -2.0% (quarter on quarter growth) (1). This sharp contraction was mostly driven by the steep decline in economic activity in March 2020 (-5.8%).
The UK economy went into ‘lockdown’ on 23rd March. Much of the economic impact stemming from the containment and social distancing policies designed to limit the spread of the coronavirus is therefore expected to be reflected in future economic data (beyond Q1). Nevertheless, it is important to understand how this 2% contraction that the UK has already experienced was shared across the regions of the UK.
In this blog we use our econometric model to see how growth for the UK as a whole, as estimated by the ONS, is allocated across the regions and nations of the UK.
Before we do this, we begin by explaining a little bit about our model. We then present our headline results, and also try to provide some sense of what might be driving these results and how they align with other data, in particular business surveys.
Our model
The full details of our econometric model can be found here. In broad terms, what our model does is provide estimates of the pattern of regional growth based on estimated historic relationships between regional and national growth and a range of macro indicators (the oil price, inflation, bank rate and the exchange rate). We discuss this in more detail shortly.
Importantly, our model produces regional growth estimates that sum up to those for the UK as a whole, as published by ONS: our model imposes what we call a ‘cross sectional restriction’. In this sense, we can think of our model as answering the question: ‘when UK GDP growth is x%, how is this allocated across the regions and nations of the UK?’.
At the same time, our model produces quarterly estimates of regional growth that constrain to the published annual regional growth estimates produced by the ONS. The latest of these provide data up to 2018.
We normally report our growth estimates as ‘growth in the year to’ a particular quarter, in other words on a rolling 4 quarter basis, and we do that here too. This measure has less volatility at a regional level than a quarter on quarter growth rate.
However, given specific interest in Q1, we also report quarterly growth estimates for 2020Q1. We should emphasise that confidence intervals around these quarterly data are higher than around the annual growth rates. There are also additional uncertainties about our estimates reflecting the unprecedented nature of the shutdown and ensuing uncertainty about how well historical relationships between economic data will hold up.
Our estimates
Our headline estimates are contained in Table 1 below. These suggest that Northern Ireland saw the biggest economic fall in 2020Q1, nearly twice that of the UK as a whole. Our model estimates also suggest that the other devolved nations and London experienced more severe contractions than the UK as a whole.
Other parts of the UK, in particular East Midlands and Yorkshire and the Humber, while experiencing a shrinking of their economies, are estimated to have seen smaller falls than the UK in 2020Q1.

It is important to understand how features of our model are driving these estimates.
There are four main drivers:
- estimated historical relationships between regional growth and UK growth (in essence: this reflects how sensitive regional growth is to UK growth);
- estimated historical relationships between the growth of particular regions (in essence: this captures how growth in region x has translated into growth in region y);
- estimated historical relationships within the regions (in essence: this captures the persistence of regional growth from one quarter to the next), and;
- estimated historical relationships between other macroeconomic variables (like the oil price, as noted earlier) and regional growth.
Comparison with business survey data
To help understand our estimates, in Chart 1 we compare them to Purchasing Managers Index (PMI) data for the regions and nations of the UK.
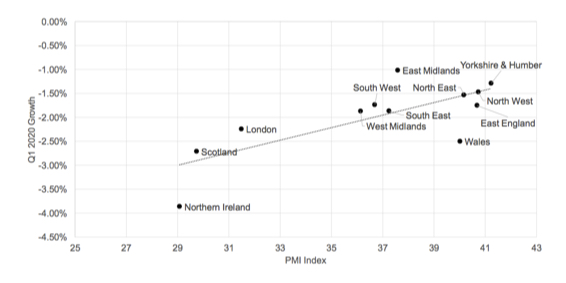
We can see that the PMI data and our own estimates seem to align well, with a clear positive relationship between our estimates and the PMI data. This is a helpful check on our model outputs.
It is also helpful to place our estimates in historical perspective and compare them with the recession in the aftermath of the global financial crisis. Chart 2 plots our quarterly regional growth from 2006Q1 to 2020Q1. To prevent the chart becoming even busier, we focus on a subset of the regions of the UK.

Chart 2 shows that while the regions entered the current Covid-19 induced downturn in a uniform manner, as the regional economies were shut down, they did not enter the recession in 2008-9 in such a synchronised manner. The current downturn is characterised by much more regional homogeneity than the last recession; and this may affect the nature of the economic recovery.
Chart 2 shows how the regional economies recovered at very different speeds after the global financial crisis.
We also draw out how, reflecting the aforementioned features of our model, our latest estimates indicating the differing economic contractions experienced by the regions, in part reflect the economic performance of each region prior to the pandemic.
Chart 3 plots average quarterly growth by region between 2018Q1 and 2020Q1 alongside our quarterly growth estimates for 2020Q1. Recall that the four quarterly estimates for 2018 add up to the annual regional growth data produced by ONS (2018 are the latest available annual data).

Chart 3 reveals a clear positive relationship. It indicates that while the shutdown has led to economic contractions in the UK and its regions, the depth of these regional contractions as estimated by our model in part reflects how well the regional economies were performing prior to COVID-19.
Conclusions
In this blog we have set out what our regional nowcasting model tells us about how the contraction of 2.0% in the UK economy in the first three months of 2020 was allocated across the regions and nations of the UK.
While these estimates are just that – estimates produced by an econometric model – we have highlighted a number of pieces of evidence and features of our results which suggest that they have some usefulness. Our method has included comparing these to business survey data and comparing the synchronicity of this economic crisis with previous crises.
We have also sought to explain in more detail how our model works to enable readers to better understand where these estimates come from, and to appreciate their strengths and weaknesses.
We hope readers find this information useful. We will re-run our model and produce updated regional nowcasts in August when UK GDP data for 2020Q2 arrive.
(1) Readers are referred to the full ONS publication which accompanied the release of UK wide GDP data for Q1 2020 for more details and context on these data. This is available here.
ESCoE blogs are published to further debate. Any views expressed are solely those of the author(s) and so cannot be taken to represent those of the ESCoE, its partner institutions or the Office for National Statistics.


