By Marilyn Thomas and Luke Weston
Trade asymmetries exist globally across trade statistics where two countries publish different estimates for the same trade flow. For example, the estimate of exports from country A to country B, should in theory, equal the estimate of imports by country B from country A. In practice, difficulties and differences in the measurement of trade flows mean that these estimates do not usually match; the difference is known as the trade asymmetry.
For statisticians and trade negotiators, trade asymmetries represent a phenomenon which they are keen to explain. For statisticians, understanding more about a country’s trade asymmetries forms part of the pursuit of publishing quality data that explains the economic experience of a country. For trade negotiators, keen to use the best quality data, understanding trade asymmetries enables the pursuit of better policy outcomes.
As the UK has now left the European Union and the single market, the UK will be negotiating more of its own trade agreements. Understanding the UK’s trading relationship with other countries has become even more important.

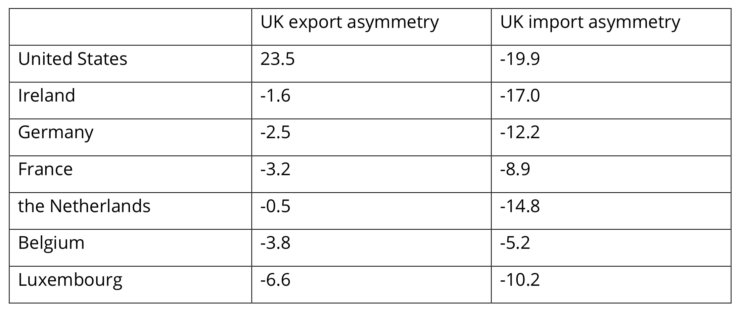
In February 2020, the Office for National Statistics (ONS) published the UK’s trade in services export and import asymmetries with seven of its trading partners: the United States, Ireland, Germany, France, the Netherlands, Belgium and Luxembourg. Here, asymmetries are reported from a UK perspective: UK exports less partner country imports and UK imports less partner country exports. Positive asymmetries mean that UK estimates are higher than partner country estimates, while negative asymmetries mean that UK estimates are lower than partner country estimates.
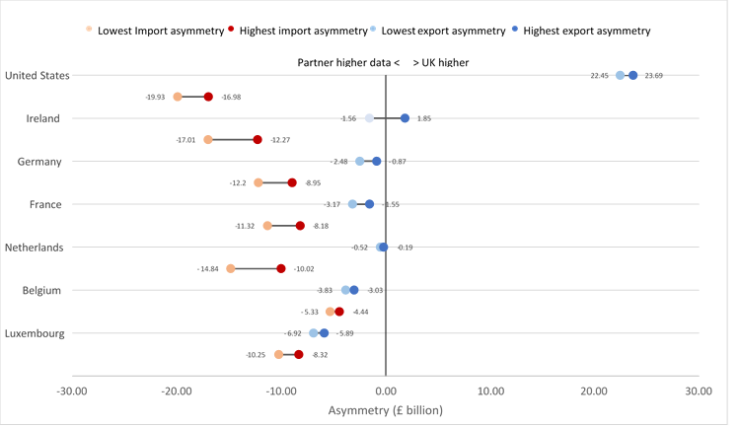
In 2018, the UK’s largest trade in services export asymmetry was with the United States (£23.5 billion). The largest trade in services import asymmetries were with the United States (-£19.9 billion), and Ireland (-£17.0 billion).
Comparing these data to previous years highlights that asymmetries are generally consistent across years. This is to be expected if asymmetries are the result of methodological differences because large changes to the reporting practices and methods used to compile trade in services statistics tend to happen only periodically.
Through international collaboration, many countries, including the UK, are engaged in trade asymmetries discussions, with the aim of understanding more about the root causes of asymmetries in each country’s official estimates. Some reasons for the UK’s trade in services asymmetries have already been analysed and published by the ONS. Some of the differences in reported estimates between countries stem from definitional differences, where trade components are allocated differently by countries or where one country includes trade that is omitted by another. Some differences reflect that some countries have moved fully to the Balance of Payments and International Investment Position Manual 6 (BPM6) while others may be in transition or not fully compliant with BPM6. Perhaps, the hardest to uncover are differences in sources and reporting methodologies where countries are using the same framework to define what they are measuring and how they should publish these data.
The issue of trade asymmetries has also lent itself to the exploration, and establishment, of various models by different institutions applying different assumptions with the aim of creating a set of aligned statistics for the purpose of trade analysis. These models help to analyse many important economic themes like employment effects, productivity effects and the impact of global value chains. They can also be used to understand more about the relative size of a country’s asymmetries. Such models have limitations, as covered in more detail in our paper.
In 2017, the Organisation for Economic Cooperation and Development (OECD) and the World Trade Organisation (WTO) published a methodology to create a global dataset of balanced trade in services statistics (BaTIS). The OECD-WTO developed the dataset using official data, supplemented by estimates using derivations, interpolations, backcasting, nowcasting and a regression model. Building on the work of Fortanier and Sarrazin (2016), imports and exports were reconciled by calculating a symmetry index weighted average between the two estimates of each trade flow.
In our ESCoE Technical Report, we closely follow this methodology to produce a series of export and import symmetry indices, and indicative ranges of reconciled values for UK total trade in services exports and imports with partner countries between 2014 and 2018. We present results for seven of the UK’s trading partners in line with the ONS asymmetries articles.
We find that UK export symmetry indices are relatively high, which indicates that UK export asymmetries across a range of trading partners are relatively low in a global context. Similarly, the export symmetry indices of some of the UK’s largest trading partners, the United States, Germany and France are also relatively high. The UK’s import symmetry indices are lower than for exports. Import asymmetries across the range of trading partners are relatively higher than for exports and rank among the mid-range of the countries explored in this paper. The import symmetry indices of some of the UK’s largest trading partners, the United States, Germany and France are relatively higher than the UK’s.
We use these symmetry indices to present a range of indicative reconciled UK trade in services values with seven of the UK’s trading partners. These estimates are implied to be between the official UK estimates and the mirror estimates of the partner country.
These trade in services data are indicative reconciled values based on the chosen methodology and assumptions used. Using different methods and assumptions would result in different values. These data are not official UK trade statistics.
As UK export asymmetries are relatively small in a global context, the indicative ranges of reconciled UK total trade in services exports to many of the UK’s trading partners are relatively close to official UK trade estimates. Where some of the UK’s trading partners have relatively small import asymmetries, indicative ranges of UK total trade in services exports are relatively close to the mid-point between the two country’s estimates. The indicative ranges of UK total trade in services imports from many of the UK’s trading partners tend towards the partner country’s estimates because UK import asymmetries are generally large across a range of countries. In light of these findings, we are carrying out further research to understand, explain, and where possible, reduce the UK’s trade in services import asymmetries.
There is further work to be done, both domestically, to further explore specific aspects of using a model to ensure the best model for this work is used, and internationally, to develop an approach that is recognised and adopted by partner countries. We support the work of the OECD-WTO to produce an updated BaTIS dataset and will be engaging closely with the OECD to propose a programme of work with partner countries, led by the OECD, to promote active engagement in work on trade asymmetries. It is important that this work is supported by other countries, as the reduction and reconciliation of trade asymmetries cannot be achieved by one country alone.
You can download and read a copy of the Technical Report in full here.
Marilyn Thomas is Head of International Trade Analysis Branch, Analysis, Microdata and Engagement Division at ONS
Luke Weston is Technical Lead, Trade Asymmetries Branch, Global Trade and Investment Division at ONS
ESCoE blogs are published to further debate. Any views expressed are solely those of the author(s) and so cannot be taken to represent those of the ESCoE, its partner institutions or the Office for National Statistics.


