By Giordano Mion and Manuel Tong
In our previous study (Mion and Tong, 2021), we examined the role of the offshore profit shifting practice by Multinational Enterprises (MNEs) in the context of the UK, and its potential impact on the measurement of GDP. Our motivation was based on MNEs’ ability to locate their intangible assets everywhere, via their subsidiaries, thereby having access to multiple heterogeneous tax locations. In a sense, profits per se are not shifted via a pure transaction or activity. It is evident that firms arrange their financing (borrow in high tax places, lend in low tax places) to reduce tax liabilities, and also to use intellectual property (IP) strategically to locate as many profits in tax havens as they can. As a result, we usually observe a mismatch between value creation and value declaration in the countries these MNE groups operate in, with an effect on their contribution to GDP in those countries.
We applied the insights of Guvenen et al. (2017), which focused on the United States, to the UK context, but moved a step forward. In our work, we considered the role of both domestic and foreign MNEs operating in the UK, which allowed us to construct a ranking of ‘winning’ and ‘losing’ countries from offshore profit shifting between 2007 and 2017.
By reallocating profits before taxes of all subsidiaries within an MNE group, following an apportionment rule based on firms’ turnover, we computed counterfactual profits before taxes per firm. Subsequently, we summed up those counterfactual values at the country-year level (based on the country in which each subsidiary is located) and compared them with the actual profits.
Under that approach, we found that the UK was a net winner in 2017 of offshore profit shifting, with a positive gap of £41 billion, equivalent to 1.91% of UK GDP that year. Conversely, in 2007 the UK was a net loser, with a negative balance of £24 billion. A more thorough analysis of the annual data showed that the net losing position in 2007 was reversed in 2009, in the aftermath of the global financial crisis, with an average annual positive balance of £40 billion. This was mostly driven by UK-owned MNEs. These results are dependent on the variable chosen for the apportionment rule. Using cost of employees instead, the UK turns from a positive to a negative offshore profit shifting result in 2017 (£5.7 billion).
Our previous study relied on the imposition of a 50% ownership threshold in each step of an ownership chain, in order to assign a firm as a member of an MNE group. How would our findings be affected by relaxing that threshold? Based on the terminology in the IMF Balance of Payments and International Investment Position Manual (BPM6), in our previous analysis we only considered MNEs’ subsidiaries. In this new study, we extend our analysis by considering associate relationships which involve between 10% and 50% of ownership.
Once again, we made use of firm-level data from Orbis, managed by Bureau Van Dijk (BvD). We obtained from Orbis balance sheet variables and ownership links whereby we retrieved the link between a firm and its corporate global ultimate owner. In order to add the associate firms into our original dataset, we followed a thorough set of steps. These allowed us to identify the immediate shareholder of each firm, followed by the corporate global ultimate owner with a minimum of 50% of ownership (GUO50C) of that immediate shareholder. Thus, our new dataset incorporates additional firms linked to a global ultimate owner with ownership shares between 10% and 50%.
Tables 1 and 2 present some basic summary statistics for 2017 and 2007, respectively, for both UK-based firms and the global dataset. Additionally, in each table we compare the figures from our previous study (considering only subsidiaries) with those from our latest analysis (including associate relationships), in order to identify an impact on our figures from having a larger dataset.


Focusing on Table 1 for 2017, we observe that associate relationships do not add much to the balance sheet statistics above subsidiary relationships. Indeed, not so many associates based in the UK and the rest of the world appear in the 2017 dataset (830 in the UK; 6,004 globally), which also influence the number of MNE groups operating in the UK (8,477 in the previous analysis vs. 8,720 in the extended dataset). As a result, both the original and extended datasets have very similar gaps between profits before taxes and operating profits.
Figures for 2007 in Table 2 give a somewhat different picture. Associate firms seem to be quantitatively important in terms of sales and profits, both in the UK and globally, even though they are not so critical in terms of their numbers (1,497 in the UK; 8,937 globally), and the number of MNE groups operating in the UK does not grow dramatically (8,105 in the original dataset vs. 8,393 in the extended one). Quantitatively this has an effect on the gap between profits before taxes and operating profits, which has clearly widened by adding these associate relationships.
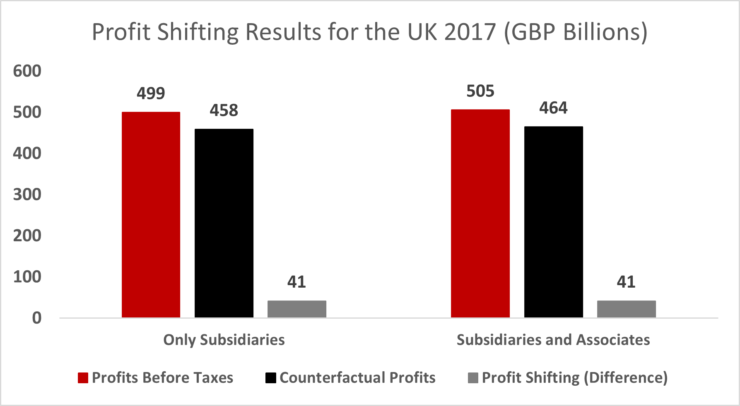
Despite the divergent balance sheet figures, we do not identify a significant change in the offshore profit shifting results in either 2007 or 2017, by considering the associate relationships. Figures 1 and 2 present a comparison of those results between the original (only subsidiaries) and the extended dataset (subsidiaries plus associates) for 2017 and 2007, respectively.
Figure 1 shows that adding associates into the analysis does not change the gap between actual and counterfactual profits in our exercise, which remains at £41 billion for the UK in 2017. In this extended analysis, the UK is still a net winner of offshore profit shifting in 2017, alongside the Netherlands (£39.5 billion), Luxembourg, France, China and Norway. Conversely, Singapore is found to be the largest net loser from offshore profit shifting in 2017 (£25.1 billion), followed by Belgium, Italy, Australia, Denmark and Spain.
Similarly, Figure 2 shows the offshore profit shifting results for the UK in 2007. It illustrates that the negative result obtained in the UK in our baseline study remains fairly unchanged. Adding associate relationships into our dataset slightly increases the net losing position for the UK in 2007 from £24 billion to £32 billion. Hence, despite being quantitatively sizeable in terms of sales and profits of the MNE groups they belong to, these associate firms do not significantly alter the disconnect between profits and sales of MNE groups operating in the UK.

For completeness, we undertook a robustness check, considering in our analysis only those unconsolidated accounts belonging to a parent company filing a consolidated account, which is the most common case in our dataset. The results of the UK being a net winner (loser) of our counterfactual profit shifting exercise in 2017 (2007) is unchanged.
Read the full ESCoE Discussion paper here.
Giordano Mion is Professor of Economics at the ESSEC Business School
Manuel Tong is an Economist at the National Institute of Economic and Social Research (NIESR)
ESCoE blogs are published to further debate. Any views expressed are solely those of the author(s) and so cannot be taken to represent those of the ESCoE, its partner institutions or the Office for National Statistics.


