By Giordano Mion and Manuel Tong

Multinational Enterprises (MNEs) tend to locate their intangible assets everywhere, via their subsidiaries, thereby having access to multiple heterogeneous tax locations and other benefits such as legal protection. This practice leads to a break in the link between value creation and value declaration, reflected in the measurement of MNEs activities and contribution to GDP in their resident countries.
A previous study by Guvenen et al. (2017) covered this issue in the context of the United States, finding that offshore profit shifting by US multinationals was associated with a ‘missing’ total of US $3.6 trillion of GDP between 1994 and 2014, and a 1.5 percentage point gap in US cumulative productivity growth.
Our study applies the insight from Guvenen et al. (2017) to the UK context. However, unlike that research, we have taken this work forward by more extensively considering the activity of both UK and non-UK multinationals operating in the UK. As a result, our study provides a country and industry breakdown of ‘losers’ and ‘winners’ of offshore profit shifting between 2007 and 2017.
For the purpose of this work, we rely on firm-level data from ORBIS[1], a dataset covering firms worldwide, compiled by the Bureau van Dijk (BvD). We retrieve from ORBIS two pieces of data. First, a financial dataset embracing all industrial firms from around 200 countries, containing balance sheet variables. Second, an ownership links dataset which provides information on the links between a firm and its owner(s)/shareholder(s) in each year. In our study, we are exclusively interested in the link between a subsidiary and its corporate global ultimate owner, with a minimum 50 per cent of ownership.
As for the financial dataset, it is not possible to distinguish in ORBIS transactions among members of the MNE group (parent plus subsidiaries) like in Guvenen et al. (2017). However, we identified that these transactions take part of the “financial revenue”, “financial expenses” and “financial profits and losses” variables. Therefore, we opted for focusing on profit/losses before taxes, which were subsequently reallocated among subsidiaries of an MNE group, based on an apportionment factor.
Our research involved a long and cumbersome cleaning, matching and merging process of both datasets, characterised by several sources of duplicates at the firm-year level. By adopting a duplicate dropping strategy, we managed to obtain a panel merging balance sheet data with ownership links of all subsidiaries belonging to MNEs with any presence in the UK for the 2007-2017 period.
With that final dataset, we proceeded to reallocate profits before taxes following an apportionment rule. The objective was to investigate how the profit distribution within each MNE group would be if profits were linked to local economic activity, expressed by the operating revenues of each firm (turnover). For robustness, we replaced turnover by cost of employees as apportionment factor.
For each subsidiary belonging to an MNE, we retrieve its profits before taxes and turnover. By multiplying the subsidiary’s PBT by its revenue share within the MNE group, we obtain a counterfactual PBT for that firm. We then aggregate the annual counterfactuals per location country. Thus, for the UK, we obtain the sum of all counterfactual PBTs of subsidiaries located in the UK, belonging to an MNE group. If that counterfactual sum is lower than the actual sum of PBTs, then the UK is a net winner from offshore profit shifting in a year. Conversely, if the counterfactual exceeds the actual PBTs, the UK will be a net loser.
Table 1 presents summary statistics of some of the main balance sheet variables for both UK-based subsidiaries and the global dataset of subsidiaries in 2017. In both cases, profits before taxes exceed the operating profits. This is a first broad sign that MNEs transfer profits from parents to subsidiaries. How would PBTs be counterfactually distributed across companies and countries if profits were proportional to sales?
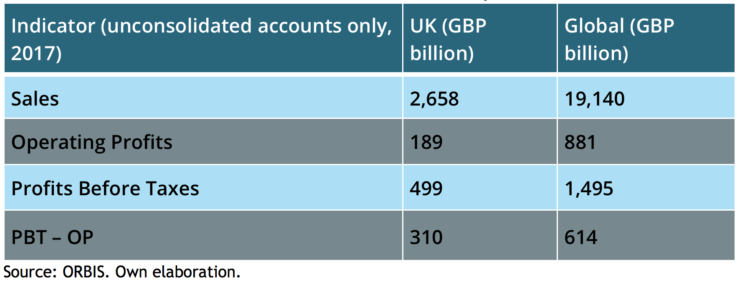
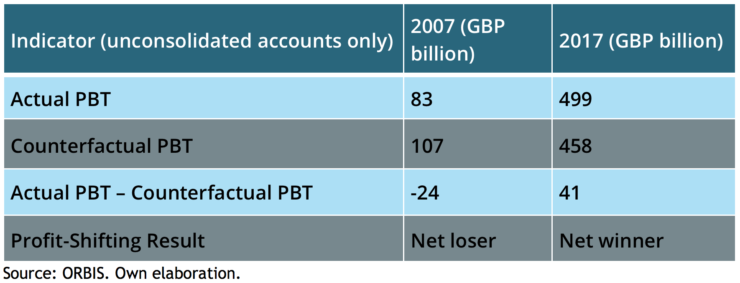
Table 2 details the results of this counterfactual exercise for UK-based subsidiaries for 2007 and 2017. Figures suggest that, since the actual PBTs exceeded the counterfactual ones, the UK was a net winner of offshore profit shifting in 2017, with a gap of an extra GBP 41 billion, equivalent to 1.91% of UK GDP that year. Moreover, this suggests that the UK was one of the top net winners in 2017, along with the Netherlands and Luxembourg. Conversely, in 2007, this suggests that the UK was a net loser, with a negative balance of GBP 24 billion. These results are dependent on the variable chosen for the apportionment. Using cost of employees instead the UK turns from the positive difference between actual and counterfactual profits of around 41 billion GBP in 2017 to a negative difference of about 5.7 billion GBP.
Looking further into the results over time for the UK for the revenue based apportionment, Figure 1 shows that the net losing position in 2007 was reversed in 2009, when the UK obtained on average a positive GBP 40 billion balance ever since. It is worthwhile to highlight that the negative results coincide with the financial crisis in 2007-2008. To complement, Figure 2 shows that the positive balance attained by the UK since 2009 is mainly driven by the performance of UK-owned MNE groups.


To gain further insights into our overall results, we produced a sectoral breakdown for the UK in 2017, using the revenue based apportionment, thereby identifying the main driving industries. Thus, we found that the top 5 contributors were industries like crude petroleum and natural gas (GBP 7.774 billion), mining of metal ores (GBP 6.842 billion), telecommunications (GBP 6.364 billion), pharmaceuticals (GBP 6.188 billion) and coke and refined petroleum products (GBP 5.883 billion). Surprisingly, this suggests the financial service activities is the industry with the largest net losing position from offshore profit shifting, despite its substantial contribution to the UK economy, with GBP -8.775 billion, followed by basic metals (GBP -3.681 billion) and machinery and equipment (GBP -2.181 billion).
Our study also conducted a series of robustness checks. Apart from replacing revenues by employment costs as apportionment factor, we experimented with the type of companies involved in the analysis and the period covered, while pointing out certain limitations of our approach related to difficulties arising from dealing with Crown Dependencies, Branches, Special Purpose Entities and Family Trusts.
We think our findings are important for the implications they have regarding the measurement of the UK’s GDP, especially the contribution to GDP by multinationals. Our study also provides several insights into how MNE groups seem to systematically advantage/disadvantage certain countries via profit shifting.
Further work developing more detailed insights are being planned, for example the impact of varying the thresholds, the drivers within particular industries and more recent data.
[1] https://www.bvdinfo.com/en-gb/our-products/data/international/orbis
You can download and read a copy of the Discussion Paper in full here.
To download zip folder of project code and result files (.do) and readmev3 descriptions of .do files please click here.
Giordano Mion is Professor of Economics at the University of Sussex
Manuel Tong is an Economist at the National Institute of Economic and Social Research (NIESR)
ESCoE blogs are published to further debate. Any views expressed are solely those of the author(s) and so cannot be taken to represent those of the ESCoE, its partner institutions or the Office for National Statistics


